۵ دقیقه با من در بورس (بخش سوم)
خطوط حمایت و مقاومت
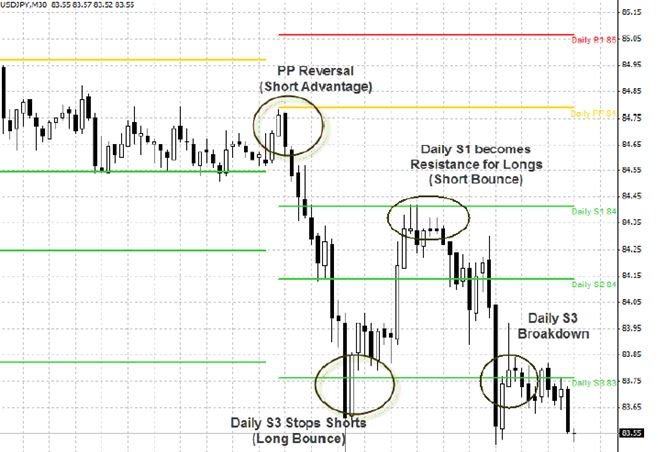
در تحلیل تکنیکال، شناسایی خطوط حمایت و مقاومت از اهمیت بالایی برخوداره و به روشهای مختلفی میتونین اونها رو شناسایی کنین.
با یکی از روشهای خطوط حمایت و مقاومت قبلا آشنا شدین، یعنی خط روند، ولی روشهایی دیگهای هم وجود داره مانند فیبوناچی، الگوهای شمعی، اندیکاتورها، ایچیموکو، امواج الیوت و غیره.
ترند لاین یا خط روند
اگه در یک بازه زمانی، مثلا در تایم فریم یک هفتهای نگاهی به یک سهمی داشته باشیم، میبینیم روند صعودی داشته ولی وقتی براش خط روند میکشیم متوجه میشیم میتونه شامل خط روندی نزولی در یک مقطعی باشه و یا شاید مجموعهای از خطوط روند صعودی و نزولی رو داشته باشه ولی در کل روند صعودی بوده.
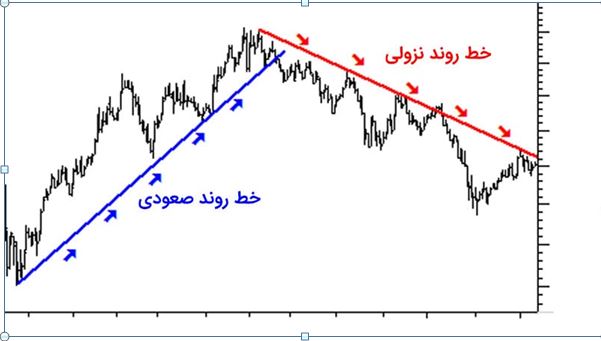
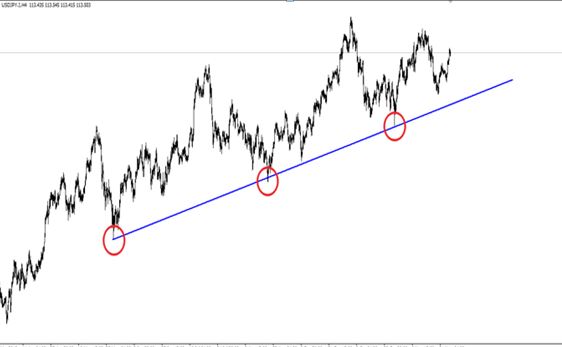
در شکل بالا در خط روند صعودی (خط آبی رنگ)، قسمتهایی رو مشاهده میکنیم که یک سری کندلها به خط روند خورده (نزولی شدن) و دوباره برگشتن یا به اصطلاح پولبک کردن و به روند صعودی ادامه دادن، یعنی این خط روند حمایتی برای سهم بوده و قیمت رو به بالا هول داده.
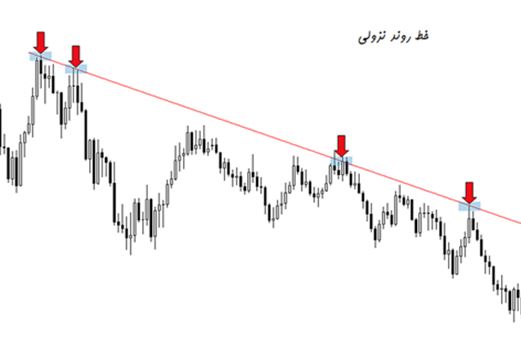
در خط روند نزولی (خط قرمز رنگ) هم یک سری از کندلها به خط روند خوردن و صعودی شدن ، باز پولبک شده و به روند نزولی ادامه دادن، پس این خط روند مقامت برای سهم بوده و قیمت رو به سمت پایین هول داده.
پیووت (Pivot)
محل تغییر قیمت (برگشت قیمت) رو پیووت میگن و دو نوع پیووت داریم پیووت در سقف یا قله و پیووت در کف.
پیووت کف
پیووت سقف
نکته:
در روند صعودی، پیووت کف رو به هم وصل میکنیم و در روند نزولی، پیووت سقف رو به هم وصل میکنیم.
نویسنده: هانیه عظیم زادگان
ترجمه به انگلیسی: هانیه عظیم زادگان
Support and resistance lines
In technical analysis, identifying support and resistance lines is importance and you can identify them in different ways.
You are already familiar with one of the methods of support and resistance lines, which are the trend line, but there are other methods as well, such as Fibonacci, candle patterns, indicators, Ichimoku, Elliott waves, and so on.
Trend line
If we look at a Stock market share in a one-week timeframe, we see an upward trend. When we draw the trend line, we realize that it can contain a downward trend line over a period of time, or maybe it has a set of ascending and descending trend lines, but in general it has been an ascending trend.
In the above figure, in the uptrend line (blue line), we see the parts where a series of candlesticks touch the trend line (descending) and they came back or so-called pullback and continued the upward trend; this means that this line is a support trend for the share of securities and has pushed the price upwards.
In the downtrend line (red line), a series of candles hit the trend line and went up, again they pull backed and continued their downward trend; so, this line is the resistance trend for the share of securities and has pushed the price down.
Pivot
Where a price returns, is called pivot. We have two types of pivot: pivot low and pivot high.
Pivot Low
Pivot High
Note:
In the uptrend, we draw the trend line on the pivot low, and in the downtrend, we draw the trend line on the pivot high.