نمودار شمعی
در بخش اول، ۵ دقیقه با من در بورس در مورد روند صحبت کردیم، وقتی بازار افت میکنه یعنی اکثرا فروشنده هستند، در این مرحله افرادی که از شرکت و برنامهریزیهای اون مطلع هستن اقدام به خرید میکنن. البته شایعه هم میتونه موجب تغییر روند بشه و کمک کنه که روند فلان سهم از حالت نزولی، صعوی بشه یا بالعکس. همچنین در مورد عرضه و تقاضا صحبت کردیم یعنی همون تحلیل قیمت. خب مشخصه برای تحلیل قیمت و روند، باید نمودارها رو بلد باشیم تا بتونیم حرکت بعدی سهم مورد نظر رو پیشبینی کنیم.
متاتریدر
این تحلیلها با دانلود متاتریدر صورت میگیره. بعد از اینکه برنامه متاتریدر رو نصب کردی، سهم مورد نظر رو انتخاب میکنی. متداولترین نمودار برای تحلیل تکنیکال، نمودار شمعی یا کندلاستیک هست. حالا هرنمودار شمعی، چهار مفهوم رو به تحلیلگر میده:
- قیمت باز (open): اول وقت که بازار باز میشه.
- قیمت بسته (close):آخر وقت که بازار بسته میشه.
- قیمت پایین (low): پایینترین قیمتی که معاملات صورت گرفته.
- قیمت بالا: (high): بالاترین قیمتی که معاملات صورت گرفته.
در بازار بورس ایران هر شمع بیانگر معاملات روزانه بوده است.
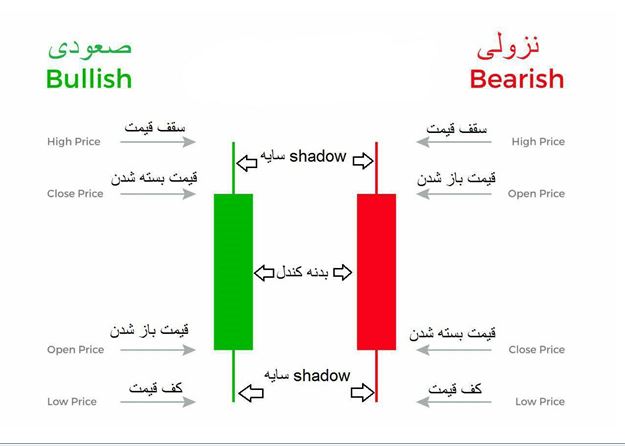
نکته:
فقط اینکه قیمت باز شدن و قیمت بسته شدن در حالت نزولی و صعودی هر کندل برعکس است. به شکل زیر دقت کنید.
TSETMC
اگه به سایت TSETMC مراجعه کنید و سهم مورد نظرتون رو پیدا کنید ، در ستون سمت راست ، اولین قیمت نشوندهنده قیمت باز شدن نمودار شمعی هست و آخرین معامله نشوندهنده قیمت بسته شدن در نمودار شمعی هست.
نویسنده: هانیه عظیم زادگان
ترجمه از فارسی به انگلیسی: هانیه عظیم زادگان
Candle Sticks
In the first part we talked about the trend. When the market is down, they are mostly sellers; at this stage, people who are aware of the company and its plans make a purchase. Of course, rumors can also change the trend and help the bearish to bullish or vice versa.
We also talked about supply and demand, which is price analysis. Well, in order to analyze the price and trend, we need to know the charts so that we can predict the next move of the desired securities.
These analyzes are done by downloading MetaTrader App.
After installing the MetaTrader program, you select the desired securities.
The most common chart for technical analysis is the candlestick chart. Each candlestick chart now gives the analyst four concepts:
- Open price: The market opens at the first time.
- Closed price: The market closes at the last time.
- Low price: The lowest price at which transactions are made.
- High price: The highest price at which transactions are made.
In the Iranian stock market, each candle represents daily transactions.
Point:
The opening price and the closing price on each candlestick are the opposite in bearish and bullish trends.
Note the following figure:
If you go to the TSETMC site and find the securities that you want, in the right column. The first price indicates the opening price of the candlestick chart, and the last trade shows the closing price in the candlestick chart.
Author: Hanieh Azimzadegan