۵ دقیقه با من در بورس
بخش اول
دونستن تحلیل تکنیکال، زبان جدیدیه که میتونی نمودارها رو رمزگشایی کنی. اولین پایه زبان شما در تحلیل تکنیکال خط روند یا ترند لاین (به انگلیسی trend line) هست. پایه تحلیل تکنیکال خط روند هست که باید یاد بگیری و شناسایی بکنی.
اصلا خط روند در بازار معاملات بورس نشونه چیه؟
قیمت . یعنی افزایش یا کاهش قیمت.
خوب این که خیلی بدیهیه و در نگاه اول اصلا پیچیده نیست. پس کار تحلیلگر تکنیکال چیه؟ اینکه بتونه خط روند رو ادامه بده و پیشبینی کنه در آیندهِ دور یا نزدیک قراره واسه فلان سهم، قیمتش چه افت و خیزی داشته باشه! یا بهتره بگیم روندش صعودیه، نزولیه، برگشتیه.
شکل زیر، روند صعودی رو نشون میده یا اصطلاحا بازار گاوی (یعنی گاو با شاخ زدن زیر سهام، قیمت را میبره بالا).
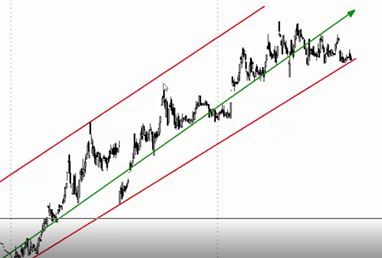
روند صعودی
دو تا خط قرمز میبینی تو شکل که موازی هم سیر صعودی داشته اصطلاحا میگن سهم در یک کانال، روند صعودی داشته. اون فلش سبز رنگ هم خط روند رو نشون میده که باز بیانگر سیر صعودیه بازار معاملاتی سهم مورد نظر بوده. حالا اینکه چی باعث شده این سهم روندش صعودی بشه به دلایل مختلف بستگی داره مثل سیاست داخلی شرکت مورد نظر، قیمت نفت، افزایش سرمایه شرکت و … که باید حواست به چنین خبرهایی هم باشه. بعدش بیای برآیند خبرهایی رو که به دست آوردی ببینی کدوم فاکتور تاثیر بیشتری روی سهم گذاشته.
خب حالا سوال میشه، دونستن خط روند به چه درد میخوره؟
اولین جواب خیلی ساده (که نمیشه گفت درست) اینه تو کَف بخری تو سقف بفروشی تا سود کنی.
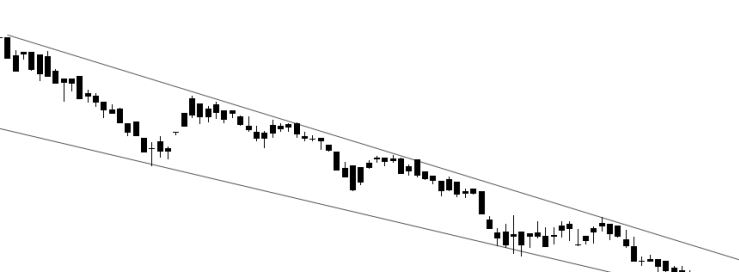
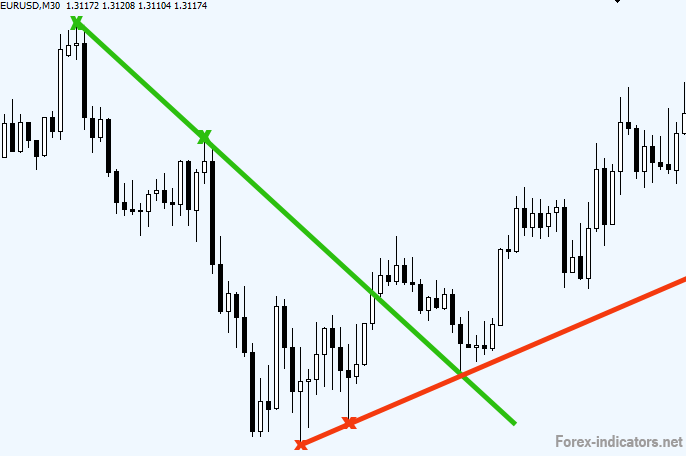
روند نزولی
شکل بالا داره روند نزولی رو نشون میده یا اصطلاحا بازار خرسی (یعنی خرس با زدن دستهاش روی سر سهم، قیمت رو میاره پایین). یعنی قیمت سهم درحال کاهشه. یعنی قیمت هر چی پایینتر میاد بخر. بعد که رفت بالا و خط روند صعودی شد، بفروش.
این سادهترین تحلیله (که البته درست هم نیست) ولی کلی تبصره و ماده داره به همین سادگیها هم نیست. اینکه کدوم نقطه بخری یا بفروشی تا سود بشتر نصیبت بشه مهمه.
قبلش اینو باید بگم چه موقع روند صعودی میشه؟
وقتی تقاضا (به انگلیسی demand) بالاست یعنی کی؟ خریدار.
چه موقه روند نزولیه؟ وقتی عرضه ( supply) بالاست یعنی کی؟ فروشنده.
نویسنده: هانیه عظیم زادگان
ترجمه از فارسی به انگلیسی: هانیه عظیم زادگان
Knowing technical analysis is a new language that you can decode charts. The first foundation of your language in the technical analysis is a trend line. The basis of technical analysis is the trend line that you must learn and identify.
What is the trend line in the stock market? A Price; that is, an increase or decrease on the price. Well, it’s obvious, and it’s not complicated at first glance. So what does a Technicalist do?
That s/he can continue and predict the trend line in the near future or long term, what price is going to fall for such and such a share! Or rather, the process is ascending, descending, reversing.
The below figure shows the upward trend or the so-called cow market.
You see two red lines in the shape that are parallel to the ascending path. That green arrow also shows the trend line, which again indicates the upward trend of the trading market.
Now, what has caused the stock market to rise is dependent on various reasons, such as the company’s domestic policy, oil prices, and the in the company’s capital increase and …. , That you have to be aware of such news.
Then see the results of the news you received, which factor has the most impact on the stock market.
So now the question is, how useful is it to know the trend line?
The first answer is very simple (which can’t be said to be true), buying on the low and selling on the high.
The above figure shows the declining trend or so-called bear market. That is, the stock market price is declining. That is, the price came more down, buy. After the price goes up and the trend line goes up, sell it.
This is the simplest analysis, but there is some points and is not that simple. It’s important to know which point to buy or sell to make the most profit. Before that, I have to say, when does the upward trend happen?
When the demanding is high. Who? Buyer.
When does the down trend happen?
When the supplying is high, who? Seller.
Author: Hanieh Azimzadegan